# install.packages("devtools")
devtools::install_github("athospd/tidywoe")WoE in R with tidywoe
tutorials
woe
WoE (weight of evidence) is a tool widely used in logistic regression applications, mainly in credit scoring. The tidywoe package offers a simple interface to make this task easier.
WoE (weight of evidence) is a tool widely used in logistic regression applications, mainly in credit scoring. Simply put, it turns categories into numbers that reflect the difference between them by how well they separate Y = 1 from Y = 0.
If you don’t know what it is yet or want to read more about it, here is a text I enjoyed reading:
The author of this text is Kim Larsen, creator of the Information package, which is complete and full of sophisticated tools around WoE. However, in my day-to-day work every now and then I had to write my own routines to build the WoE versions of my variables, even with several complete packages available. The main reason was that they weren’t very practical and didn’t fit the tidyverse philosophy. So I ended up gathering these routines into a package called tidywoe and putting it out there. The idea is to help the analyst gain time, readability and reproducibility. Here is how to use it.
Installation
To install it, just run the code below.
Data and packages for the examples
library(forcats)
library(ggplot2)
library(dplyr)
library(tidywoe)

# install.packages("FactoMineR")
data(tea, package = "FactoMineR")
tea_mini <- tea %>% select(breakfast, how, where, price)
How to use
There are two functions that matter: - add_woe() - adds the woe’s to a data frame. - woe_dictionary() - creates a dictionary that maps the categories to their woe’s.
add_woe()
The add_woe() function adds the WoE versions of the variables to your data sample.
tea_mini %>% add_woe(breakfast)| breakfast | how | where | price | how_woe | where_woe | price_woe |
|---|---|---|---|---|---|---|
| breakfast | tea bag | chain store | p_unknown | -0.0377403 | -0.0451204 | -0.2564295 |
| breakfast | tea bag | chain store | p_variable | -0.0377403 | -0.0451204 | 0.1872882 |
| Not.breakfast | tea bag | chain store | p_variable | -0.0377403 | -0.0451204 | 0.1872882 |
| Not.breakfast | tea bag | chain store | p_variable | -0.0377403 | -0.0451204 | 0.1872882 |
You can pick the variables you want by selecting them just like in dplyr::select().
tea_mini %>% add_woe(breakfast, where:price)woe_dictionary()
The woe_dictionary() function is one of the two parts needed to make add_woe() work (the other part is the data). It builds the dictionary of categories and their respective woe’s.
tea_mini %>% woe_dictionary(breakfast)| variable | explanatory | n_tot | n_breakfast | n_Not.breakfast | p_breakfast | p_Not.breakfast | woe |
|---|---|---|---|---|---|---|---|
| how | tea bag | 170 | 80 | 90 | 0.5555556 | 0.5769231 | -0.0377403 |
| how | tea bag+unpackaged | 94 | 50 | 44 | 0.3472222 | 0.2820513 | 0.2078761 |
| how | unpackaged | 36 | 14 | 22 | 0.0972222 | 0.1410256 | -0.3719424 |
| where | chain store | 192 | 90 | 102 | 0.6250000 | 0.6538462 | -0.0451204 |
Using a custom dictionary
Often we want to adjust some woe values by hand to fix the order of the effects of a given ordinal variable. That’s why add_woe() can take a dictionary passed by the user. This is done through the .woe_dictionary argument.
The easiest way to do this is to build an initial dictionary with woe_dictionary() and then change its values to get the adjustments you want. Example:
# Build an initial dictionary
tea_mini_woe_dic <- tea_mini %>% woe_dictionary(breakfast)

# Tweak the woes a little
tea_mini_woe_dic_arrumado <- tea_mini_woe_dic %>% mutate(woe = if_else(explanatory == "p_unknown", 0, woe))

# Pass this dictionary to add_woe()
tea_mini %>% add_woe(breakfast, .woe_dictionary = tea_mini_woe_dic_arrumado)| breakfast | how | where | price | how_woe | where_woe | price_woe |
|---|---|---|---|---|---|---|
| breakfast | tea bag | chain store | p_unknown | -0.0377403 | -0.0451204 | 0.0000000 |
| breakfast | tea bag | chain store | p_variable | -0.0377403 | -0.0451204 | 0.1872882 |
| Not.breakfast | tea bag | chain store | p_variable | -0.0377403 | -0.0451204 | 0.1872882 |
| Not.breakfast | tea bag | chain store | p_variable | -0.0377403 | -0.0451204 | 0.1872882 |
Exploration example
woe_dictionary() returns a tidy table, very convenient for further exploration. For example, the table is ready for ggplot.
tea_mini_woe_dic_arrumado %>%
  mutate(explanatory = explanatory %>% as.factor %>% fct_reorder(woe)) %>%
  filter(variable %in% c("price", "how")) %>%
  ggplot() +
    geom_bar(aes(x = explanatory, y = woe), stat = "identity") +
    facet_wrap(~variable, scales = "free_x") +
  theme(axis.text.x = element_text(angle = 30))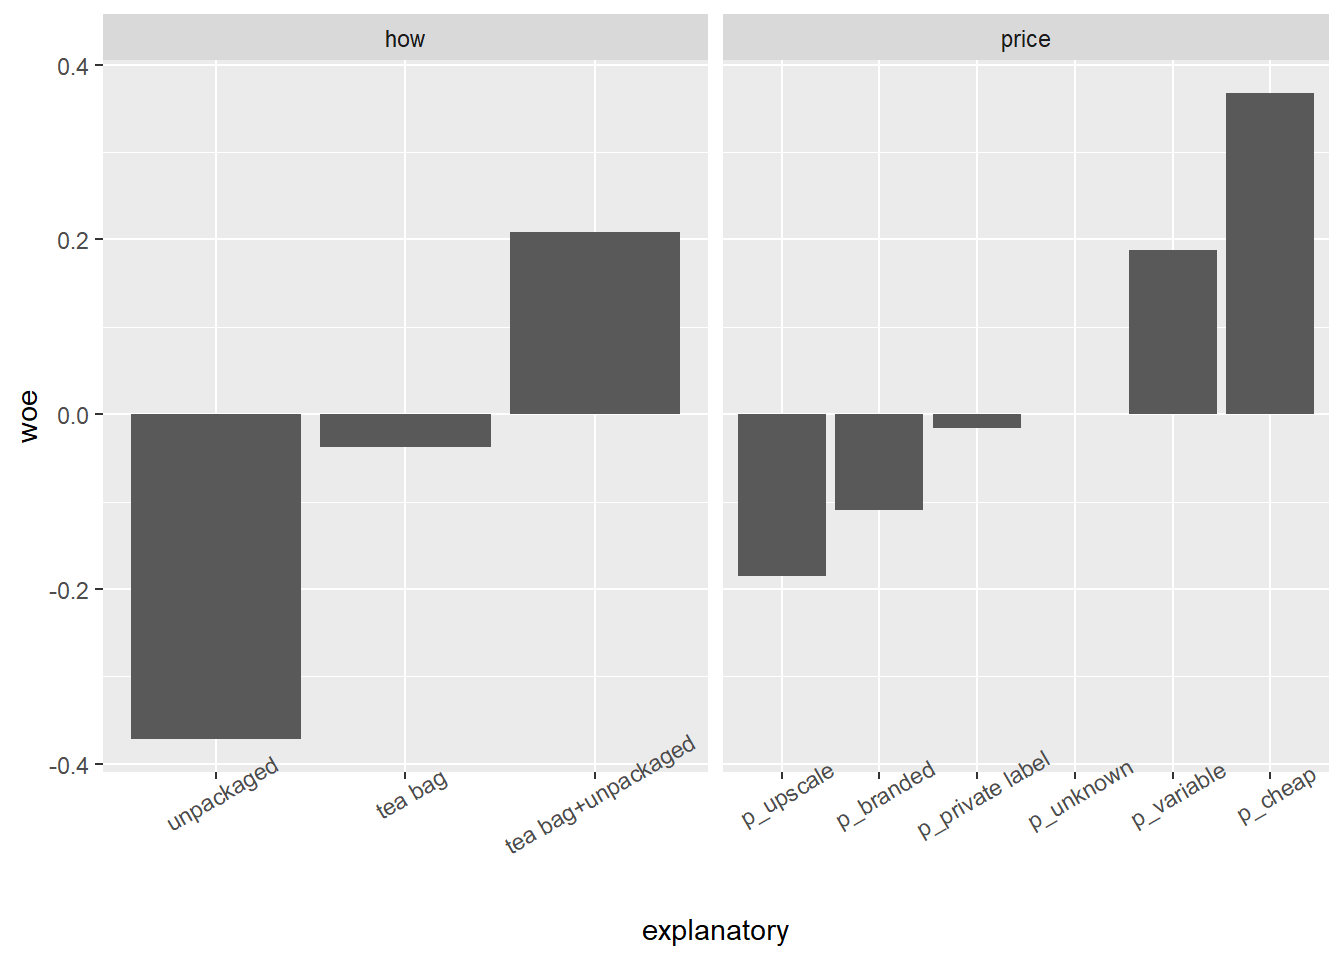
Here is the package’s github for contributions. I still plan to add a lot of new stuff to the package.
Cheers