library(keras)
library(tidyverse)
library(decryptr)

path <- "."
arqs <- dir(paste0(path,  "/train_imgs"), full.names = TRUE)
resp <- readr::read_csv(paste0(path,  "/train_responses.csv"))

i_train <- sample(1:nrow(resp), 10000)
arqs_train <- arqs[i_train]
arqs_test <- arqs[-i_train]

gen <- function(batch_size = 100, arqs = arqs_train) {
  f <- function() {
    a <- sort(sample(arqs, batch_size))
    imgs <- decryptr::read_captcha(a)
    captchas_t <- purrr::transpose(imgs)
    xs <- captchas_t$x
    xs <- abind::abind(xs, along = 0.1)
    a_clean <- a %>%
      basename() %>%
      tools::file_path_sans_ext() %>%
      tolower()
    corr <- resp %>%
      filter(id %in% a_clean) %>%
      arrange(id) %>%
      pull(corr)
    data <- list(xs, corr)
    data
  }
  f
}


# Create model
model <- keras_model_sequential()
model %>%
  layer_conv_2d(
    input_shape = c(150, 150, 1),
    filters = 16, kernel_size = c(3, 3),
    padding = "same",
    activation = "relu") %>%
  layer_max_pooling_2d() %>%
  layer_conv_2d(
    filters = 32, kernel_size = c(3, 3),
    padding = "same",
    activation = "relu") %>%
  layer_max_pooling_2d() %>%
  layer_conv_2d(
    filters = 64, kernel_size = c(3, 3),
    padding = "same",
    activation = "relu") %>%
  layer_max_pooling_2d() %>%
  layer_flatten() %>%
  layer_dense(units = 300) %>%
  layer_dropout(.1) %>%
  layer_dense(units = 1, activation = "tanh")


# Compile and fit model
model %>%
  compile(
    optimizer = "sgd",
    loss = "mean_squared_error",
    metrics = "mean_squared_error")

model %>%
  fit_generator(
    gen(100, arqs_train),
    steps_per_epoch = 100,
    validation_data = gen(100, arqs_test),
    validation_steps = 10
)Bring it on - Guess The Correlation Kaggle Competition
announcements
kaggle
deep learning
We created a Kaggle competition to teach the machine to guess the correlation of a scatterplot. Challenge on!
Hellooo community
We launched a Kaggle competition and now it’s time to show you are a DATA SCIENCE Jedi! =D
Link: https://www.kaggle.com/c/guess-the-correlation/
We did this for sport, please don’t try to find any use for this application =P.
The Game
The Guess The Correlation website puts a human face to face with a scatterplot and then challenges them to guess its linear correlation.
Our Kaggle challenge is built the same way. For example: what would you guess is the correlation of the data in the figure below?
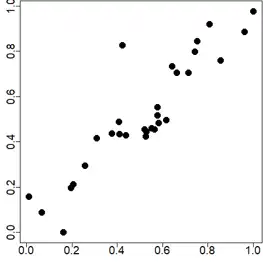
We generated 200 thousand png images like the one above, and each one has its correlation labeled so we can train a little model.
Goal
The goal is simple and direct: build a robot that computes the (linear) correlation just by looking at the scatterplot.
In machine learnese, we want
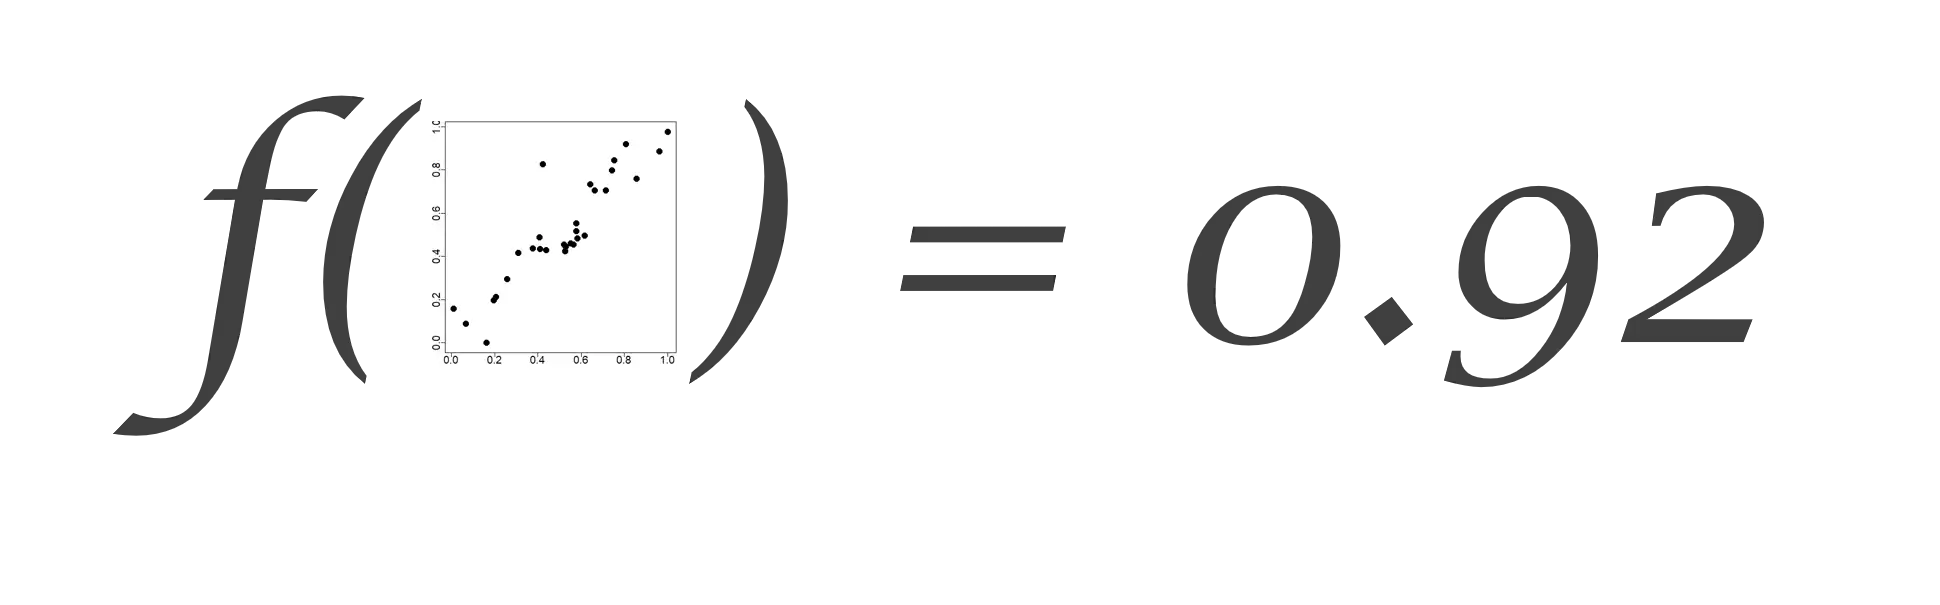
where this f is worthy of being the f in F@!#.
Initial guess
Julião has already been working on this problem and took an initial shot at the code for you to get inspired. Well, “initial” is a stretch, because he went straight to a CNN with the help of the decryptr package:
So? Can you get it 100% right? Or is it impossible?
Happy R’ing!