library(tidyverse)
library(jpeg)
# loads a jpeg image into R
download.file("http://curso-r.comimages/posts/conteudo/desafio-recuperacao-img/purple_wave.webp",
              destfile = "purple_wave.jpg")

img <- readJPEG("purple_wave.jpg")

# turns the image array into a data.frame with position (x,y)
# and color (r,g,b) info; image dimensions
img_dim <- dim(img)

# RGB to data.frame
img_df <- data.frame(
  x = rep(1:img_dim[2], each = img_dim[1]),
  y = rep(img_dim[1]:1, img_dim[2]),
  r = as.vector(img[,,1]),
  g = as.vector(img[,,2]),
  b = as.vector(img[,,3])
) %>%
  mutate(cor = rgb(r, g, b),
id = 1:n())Data Challenge - Image recovery
announcements
app
packages
In the second edition of the Data Challenge we’ll try to recover the color of an image using regression and decision tree models.
Files with the .jpg extension store 5 coordinates, which are enough for the computer to understand and draw the image:
xandy: the cartesian coordinates of the image; andr,gandb: red, green and blue, respectively, which together form colors.
Every color we know can be made by combining these three colors. The intensity of each color ranges from 0 to 1. For each point on the (x,y) plane there is an associated color. So an image can be represented by a dataset with 5 columns (x, y, r, g and b) whose number of rows is the number of pixels in the image.
Goals
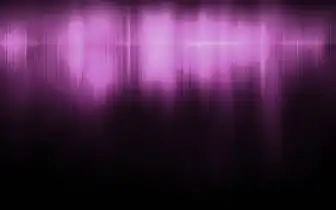
- Find out which model, linear regression or decision trees, is the most suitable to recover the blue component of the purple_wave.jpg image.
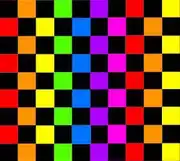
- Find out which model, linear regression or decision trees, is the most suitable to recover the blue component of the xadrez_colorido.jpg image.
How to start?
With the help of the readJPEG() function from the jpeg package, load one of the images into R and turn it into a data.frame:
Split the data.frame into two parts: one with the blue (column b) and one without. - Part 1) x, y, r, g - Part 2) x, y, r, g, b
# for reproducibility
set.seed(2018)
# Part 1) x, y, r, g
img_df_parte1 <- img_df %>%
  sample_frac(3/5) %>% # taking 3/5 of the dataset
  mutate(b_backup = b, # backup of the original blue
         b = 0, # removing the blue from the image
         cor = rgb(r, g, b)) # image color without the blue
# Part 2) x, y, r, g, b
img_df_parte2 <- img_df %>% filter(!id%in%img_df_parte1$id)
Visualizing:
# Image without the blue
ggplot(data = img_df_parte1, aes(x = x, y = y)) +
  geom_point(colour = img_df_parte1$cor) +
  labs(x = "x", y = "y", title = "Imagem sem B (azul)") +
  coord_fixed(ratio = 1) +
  theme_bw()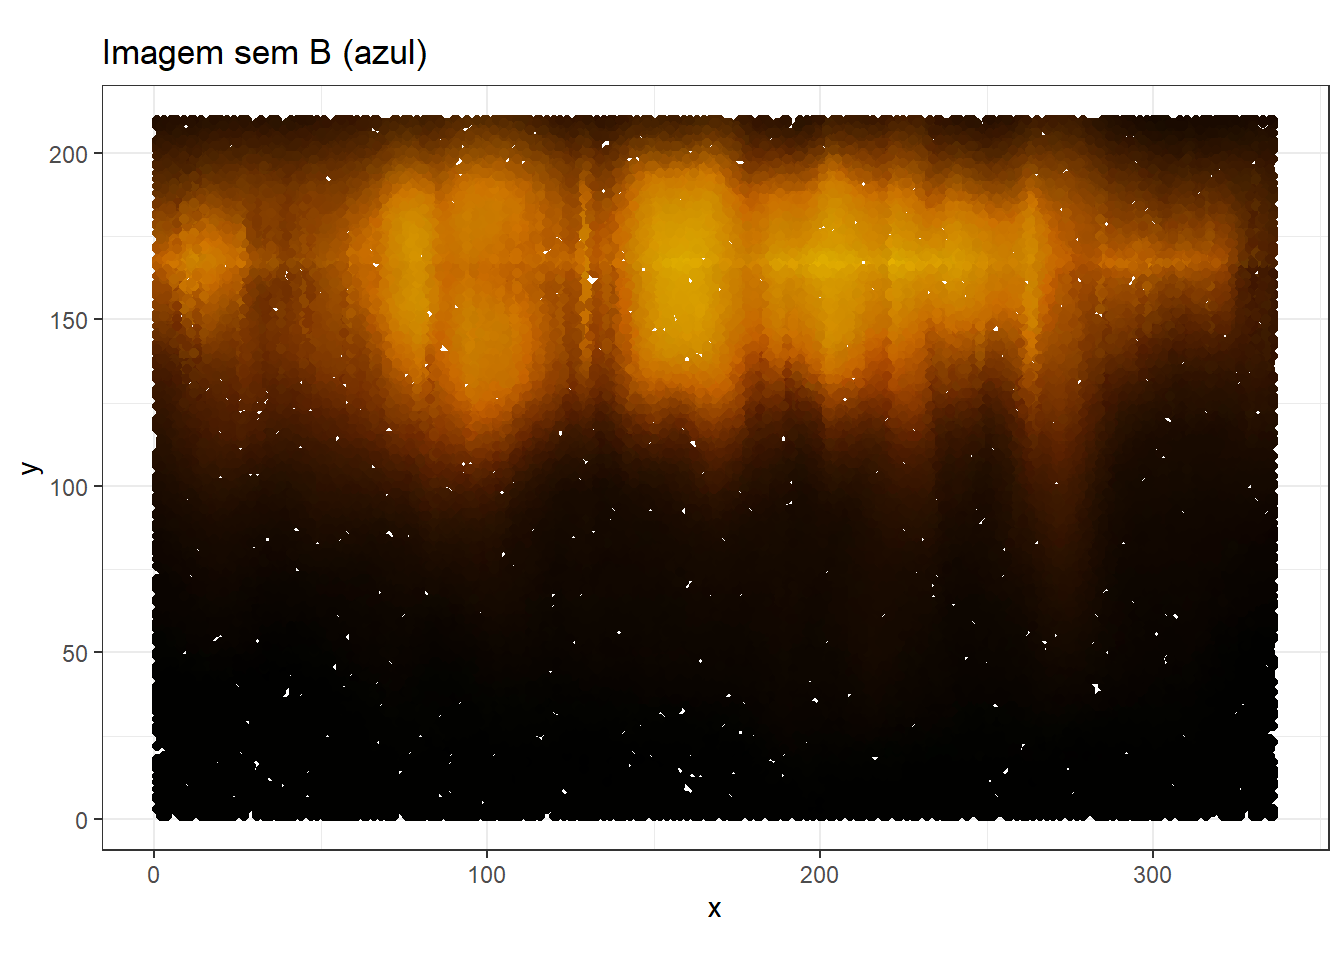
Your task is to recover the blue (which we erased from the image) in Part 1, using predictive models built with Part 2 (which still has the blue!) for both images (xadrez_colorido and purple_wave).
Result
The result of this data challenge will be published on the blog on August 24! Good luck!